Find Real EstateThat Cash Flows
Analyze real estate with powerful financial metrics, AI insights, and data-driven tools to maximize your ROI.

Discover Investment Opportunities
Browse properties with instant financial metrics to identify the best deals


Everything You Need to Invest Smarter
Powerful tools and insights to help you find, analyze, and secure profitable investment properties
Smart Property Search
Search thousands of properties with advanced filters for location, price, bedrooms, and more.
Investment Calculator
Calculate cash flow, cap rate, ROI, and cash-on-cash return with customizable assumptions.
Market Analytics
Access detailed market data, price history, tax information, and comparable properties.
AI-Powered Insights
Get instant AI analysis of properties with personalized recommendations and risk assessment.
Location Intelligence
Evaluate neighborhoods with walk scores, transit scores, school ratings, and local amenities data.
Save & Compare
Save favorite properties and make informed decisions.
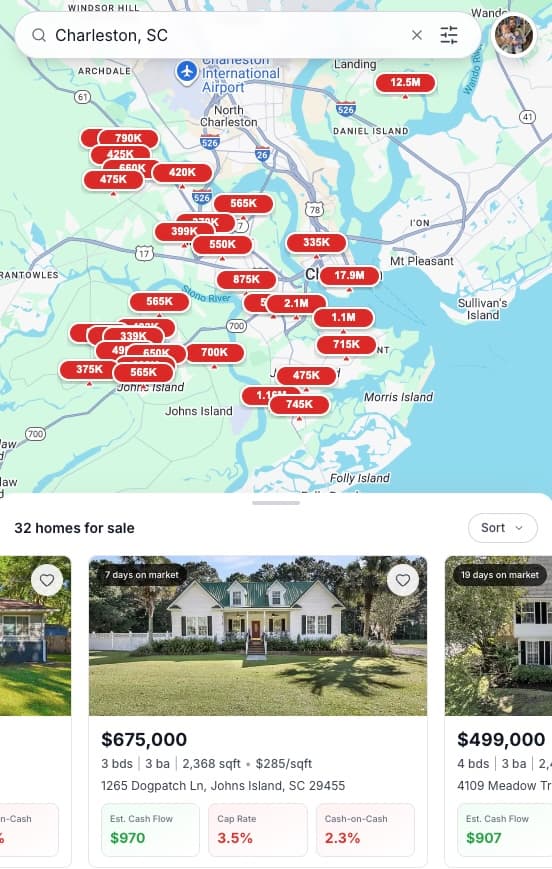
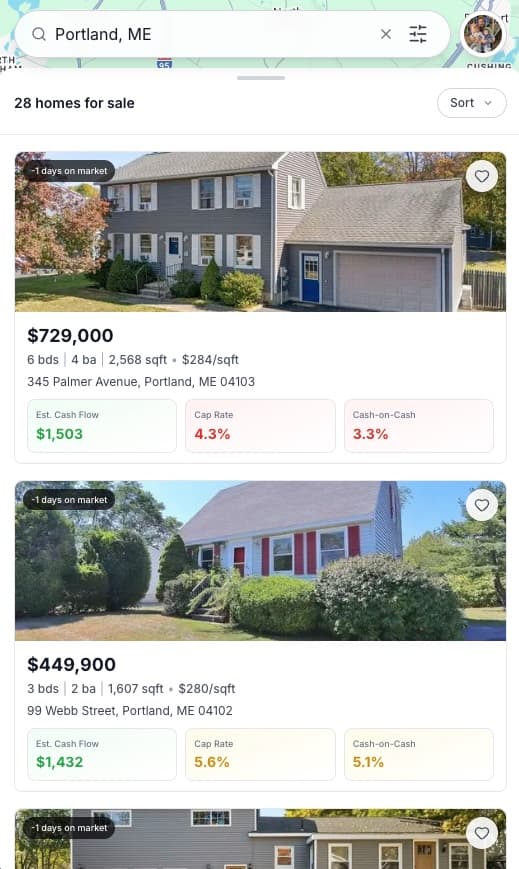
Discover Properties with Interactive Map Search
Explore investment opportunities with our advanced map-based search. Filter by location, price range, property type, and instantly see financial metrics for every listing.
Search Anywhere
Browse properties across 20,000+ cities nationwide
Smart Filters
Refine results by beds, baths, price, property type, and more
Instant Analysis
See cap rate, cash flow, and ROI calculated in real-time
Key Investment Metrics
Make data-driven decisions with comprehensive financial analysis
Monthly Cash Flow
Net income after all expenses including mortgage, taxes, insurance, and operating costs
NOI ÷ 12 - Monthly Debt Service
Cap Rate
Capitalization rate showing property return as a percentage of purchase price
NOI ÷ Purchase Price
Cash-on-Cash Return
Annual return on your actual cash invested in the property
Annual Cash Flow ÷ Cash Invested
DSCR (Debt Service Coverage Ratio)
Measures the property's ability to cover mortgage payments
NOI ÷ Total Debt Service
Annual NOI
Net Operating Income after all operating expenses but before debt service
Gross Income - Operating Expenses
1% Rule
Quick screening tool - monthly rent should equal 1% of purchase price
Monthly Rent ÷ Purchase Price
Sample Analysis
$450,000 Property · $3,750/mo rent
Cash Flow
PositiveNet income after expenses
Cap Rate
AnnualStrong: >8%
Cash-on-Cash
ReturnStrong: >8%
Cash Needed
UpfrontDown + closing costs
DSCR
RatioStrong: >1.25x
1% Rule
CloseTarget: ≥1% of price
Annual NOI
NetNet operating income
Monthly Debt
PaymentMortgage payment
Down Payment
20%Cash required upfront
Est. Rent
MonthlyEstimated rental income
How It Works
Start analyzing properties in seconds with our simple 3-step process
Search Properties
Enter a location and filter by price, bedrooms, property type, and more to find potential investments.
Analyze Metrics
View instant financial calculations including cash flow, cap rate, ROI, and get AI-powered insights.
Make Decisions
Save your favorites and make confident investment decisions.
Latest Investment Guides
Free guides to help you analyze deals, understand key metrics, and invest smarter
Real Estate Investing for Beginners: The Complete Guide
15 min readrental analysisHow to Analyze a Rental Property in 5 Steps
10 min readcap rateHow to Calculate Cap Rate: A Complete Guide
8 min readcash on cash returnCash on Cash Return Explained: Formula & Examples
7 min readhouse hackingHouse Hacking: How to Live for Free with Real Estate
9 min readBRRRRBRRRR Method Explained: Buy, Rehab, Rent, Refinance, Repeat
10 min readReady to Find Your Next Investment?
Join thousands of investors who use PropertyDNA to make smarter real estate decisions. Start analyzing properties for free today.